Root Cause Analysis (RCA) in IT Environment – How to connect the Dots ‘Layered Approach’


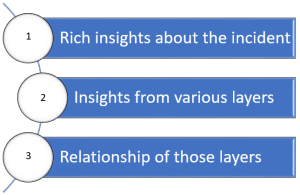
Most of us have heard of the ‘5 Whys’ technique and lot more tools for the RCA. Irrespective of the tools and techniques, to make the RCA effective, it is imperative to have the 3 items listed below

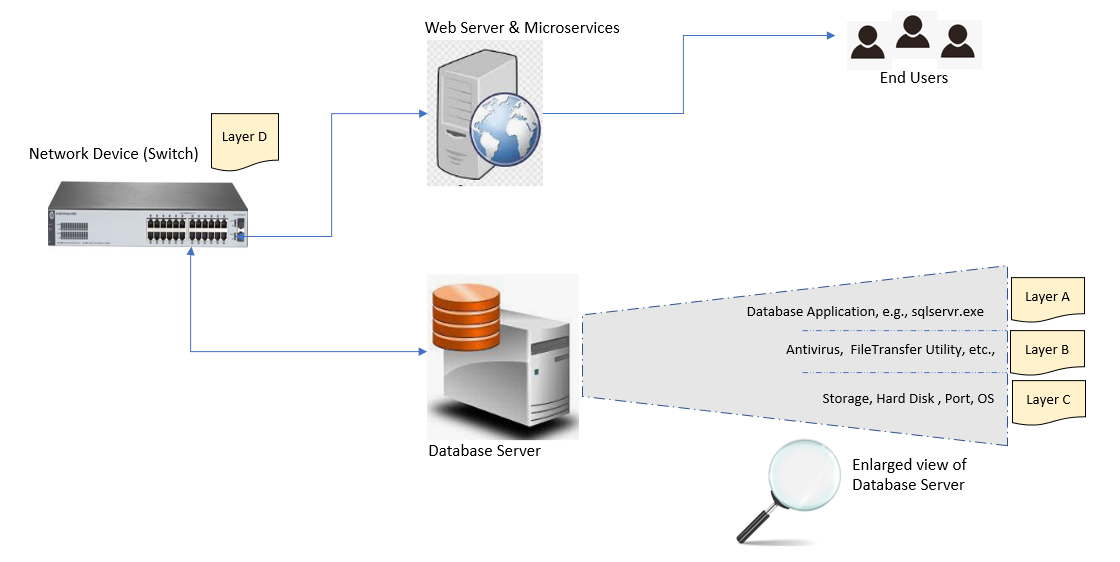
Let us understand more about the layers and how to use them for RCA. There are 4 key layers for a problem or incident in an IT environment and they are as follows
Layer A – The Application/Process/Software/Firmware that faces the issue
Layer B – The Application/Process/Software/Firmware that exists along with Layer A
Layer C – The Device/Server in which Layers A and B are running
Layer D – Other Devices/servers/Network Connectivity/External factors that co-exists and participate in this ecosystem
When RCA is to be done, slice your environment into these layers and relate the insight from these layers to arrive at the RCA. In the Figure 2 below, we can see how the Database and Web server along with Network Devices are depicted in layers. Let us take a service availability and reliability issue of a Web Application and go through various scenarios and the RCA in each type.

Scenario 1 – The Network device (Layer D) has got a recent firmware upgrade and that didn’t go well, which resulted in connectivity issue between Container/Microservices layer and DB layer which are connected via this Network device, as a result the Web application is facing DB connectivity issue and user is unable to view the data in UI.
Scenario 2 – Due to recent hardening activity from security point of view, there was a recommendation to avoid default port in server (Layer C) and go for a different port to avoid security attach. While this has been done by the Server team across various servers, this change was not communicated to the Application team and the web application still is trying to reach the default port. This caused the database connectivity issue and impacted the application, where the user is unable to view the data in UI.
Scenario 3 – The Storage Disk (Layer B) of the database is not functioning properly and that resulted in Query timeout. This caused the impact on the application, where the user is unable to view the data in UI. In this case “Physical Disk Avg. Disk sec/Transfer” is high and the FileTransfer utility in the Database server was reading and writing heavily at that time, which has kept the disk busy, and that impacted the database read/write resulted in query timeout
Scenario 4 – The database application (e.g. Sqlservr.exe) (Layer A) service didn’t auto start properly after rebooting the machine. This caused the database connectivity issue and impacted on the application, where the user is unable to view the data in UI.
In all these scenarios, we have seen the Root cause and it varies in each scenario. The respective IT, Application, Server, Network team may follow a similar process as given in Figure 1 and 2, but doing these steps manually is almost not possible in practical situations. The other challenges are,
In all these scenarios discussed above, it is clear that the problem in any Layer (A, B, C, D) may impact the other layer(s) and affect the environment in an unexpected way. Hence, it is important to know how the various components like Core switch, Router, Floor Switch, L2, L3, Firewall, Servers, Virtual Environments, Workloads in Cloud are related to each other. Similarly, the list of Processes or Applications, Microservices, Containers running inside a server or device and how they are related to each other are to be known.

ZIFTM provides the RCA through the Unified solution. ZIFTM Discovery, ZIFTM Monitoring and ZIFTM A&P does this seamlessly by discovering all the layers, like physical and logical, and application layer along with relationship. Since relationship is available automatically, the process of narrowing down the Root Cause is natural and accurate in ZIFTM with all the insights.
Please complete the form details and a customer success representative will reach out to you shortly to schedule the demo. Thanks for your interest in ZIF!
Notifications