In the dynamic realm of digital experience management, the ability to transform raw data into meaningful insights is crucial. ZIF Dx+ stands out not just for its robust monitoring capabilities but also for its exquisite artistry in data visualization. Let’s explore how ZIF Dx+ dashboards elevate the visualization of complex data, turning it into a canvas of actionable insights.
Unlocking the Power of Visualization
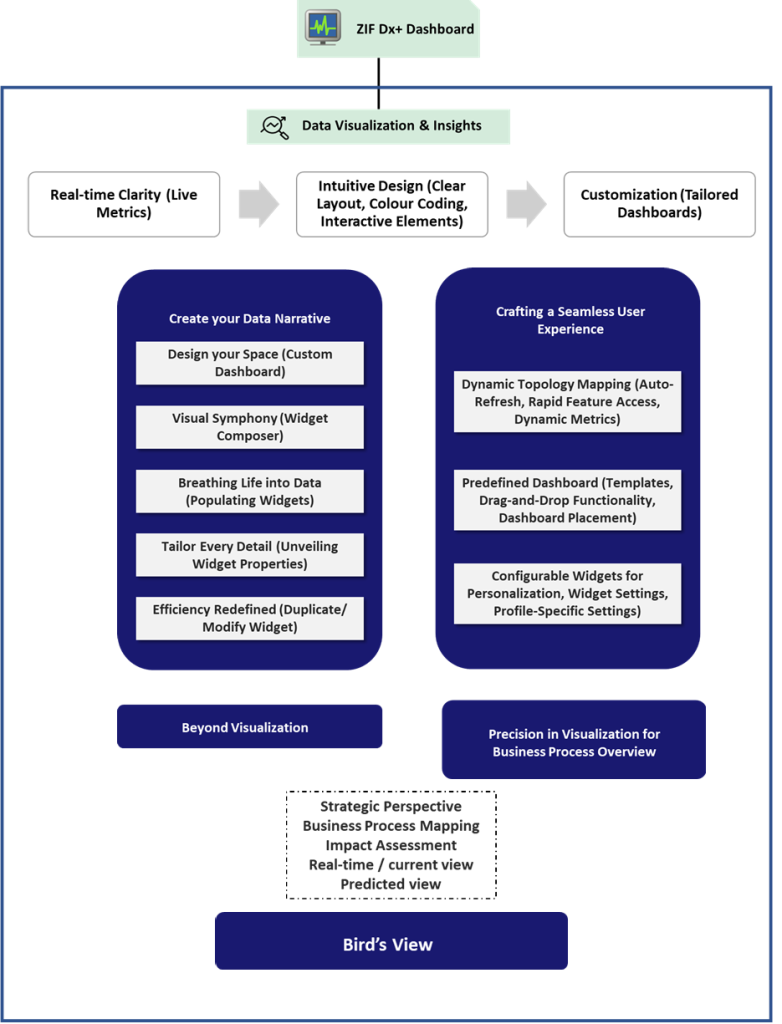
Data visualization is more than just creating aesthetically pleasing charts; it’s about telling a compelling story with data. ZIF Dx+ understands this, and its dashboards serve as a storytelling medium for IT professionals, allowing them to decipher intricate patterns and make informed decisions.
Real-time Clarity: ZIF Dx+ dashboards provide real-time visibility into critical performance metrics. From CPU and memory utilization to network activity, the dashboards offer a live feed of data, enabling IT teams to stay ahead of potential issues.
Intuitive Design: The intuitive design of ZIF Dx+ dashboards ensures that even complex data sets are presented in a user-friendly manner. Clear layouts, color-coded charts, and interactive elements make it easy for users to grasp the information quickly.
Customization for Precision: Recognizing that different stakeholders have unique requirements, ZIF Dx+ empowers users with customization options. Admins can tailor dashboards to focus on specific metrics, ensuring that each viewer gets the insights most relevant to their role.
ZIF Dx+ harnesses the power of dashboards in accelerating insights and tailoring visualizations with the user-defined dashboards feature. This functionality empowers you to construct and oversee personalized dashboards, offering the flexibility to create, add, and modify bespoke widgets. These widgets serve as dynamic tools, allowing you to visually represent and analyze key metrics that hold significance for your organization.
Create Your Data Narrative: A Guide to ZIF Dx+ Custom Dashboards
Unlock the potential of ZIF Dx+ as you embark on a journey to curate personalized dashboards tailored to your organization’s needs.
Design Your Space: Creating a Custom Dashboard – Lay the foundation for your insights by fashioning a custom dashboard that mirrors your specific goals and preferences.
Visual Symphony: Navigating the Widget Composer – Dive into the Widget Composer – your creative hub for designing visually compelling widgets that bring key metrics to life.
Breathing Life into Data: Populating Your Widgets– Populate your dashboard with widgets that matter. Choose elements that resonate with your data visualization requirements, building a cohesive narrative.
Tailor Every Detail: Unveiling Widget Properties – Fine-tune the specifics with Widget Properties. Customize appearance, behavior, and data sources, ensuring each widget aligns precisely with your vision.
Efficiency Redefined: Duplicating/Modifying Widgets for Seamless Creation– Streamline your dashboard creation process by duplicating widgets. Enhance efficiency as you replicate and modify widgets seamlessly for a cohesive layout.
Crafting a Seamless User Experience
ZIF Dx+ doesn’t just stop at presenting data— it aims to enhance the overall user experience.
Dynamic Topology Mapping: Visualizing the journey of applications is made seamless with ZIF Dx+’s dynamic topology mapping. Admins can effortlessly navigate through the intricate connections between processes, gaining a holistic understanding of the application landscape.
Auto-Refresh for Real-time Updates: ZIF Dx+ ensures that users are always in the loop with auto-refresh features. As data evolves, the dashboards update in real-time, providing continuous insights without the need for manual intervention.
Rapid Feature Access: ZIF Dx+ streamlines your experience by providing quick access to a diverse array of features, ensuring you can effortlessly explore its capabilities.
Dynamic Metrics Section: Stay in the know with the dynamic metrics section, offering real-time information on crucial data points within your organization. ZIF Dx+ ensures your insights are always up to date.
Multiple Dashboards for Varied Perspectives: Tailor your ZIF Dx+ experience by adding multiple dashboards, each offering a unique perspective. Effortlessly switch between them or activate auto rotate for seamless dashboard swapping.
Auto-Rotate Feature: Enhance your dashboard viewing experience by enabling the auto-rotate feature. Watch as your dashboards seamlessly transition, providing a comprehensive overview of key metrics.
Predefined Dashboard Templates: Jumpstart your dashboard creation process with ZIF Dx+’s predefined templates. Choose from a selection of templates, readily available for users, simplifying the dashboard creation journey.
Intuitive Dashboard Placement: Widgets can be effortlessly positioned on the dashboard canvas, enhancing user flexibility and customization.
Drag-and-Drop Functionality: Click and drag functionality ensures a seamless user experience, allowing for intuitive dashboard design.
Configurable Widgets for Personalization:
Widget Settings Option: Each widget is equipped with a settings option, empowering users to apply filters tailored to their data preferences.
Profile-Specific Settings: User-selected filters are seamlessly saved to individual profiles, ensuring a personalized experience.
Agile Deployment with Zero Downtime:
New Insights as Widgets: Introduce fresh insights seamlessly by developing and deploying them as widgets into the production environment.
Zero Downtime Assurance: Experience uninterrupted operations during the deployment of new insights, ensuring continuous productivity.
Beyond Visualization: Actionable Insights and Proactive Solutions
While visual appeal is essential, the true value of ZIF Dx+ dashboards lies in their ability to drive action.
Alerts and Predictive Analytics: ZIF Dx+ dashboards are equipped with alert mechanisms that instantly notify users of potential issues. Moreover, its digital experience analyticsand predictive analytics features help forecast trends, allowing proactive measures to be taken before problems escalate.
Self-Healing Indicators: The dashboards serve as a control center for ZIF Dx+’s self-healing capabilities. Users can monitor self-healing indicators, ensuring that the system is continuously optimized for peak performance.
Precision in Visualization for Business Process Overview
In the expansive landscape of ZIF Dx+, the “Bird’s View” stands as a strategic vantage point within the dashboard section. Specifically curated for CXOs, this comprehensive view unfolds the IT landscape, mapping the intricate relationships from business processes to business services, applications, and devices.
Business Process Mapping: Gain insights into the seamless flow from business processes through business services to applications and devices.
Impact Assessment: Understand the nuanced impact of device failures on critical business processes.
Current View: Real-Time Enterprise Status: Experience real-time visibility into the enterprise’s status, ensuring immediate awareness.
Predicted View: Forecasted Enterprise Impact: Anticipate future scenarios with a forecasted view, enabling proactive decision-making.
The “Bird’s View” in ZIF Dx+ provides CXOs with a dynamic tool for understanding the intricate connections between business processes and IT components. As your organization navigates the digital landscape, ZIF Dx+ is one of the best digital experience solutions, its strategic perspective ensures a proactive and informed approach to IT management.
Conclusion
In conclusion, ZIF Dx+ transcends traditional monitoring solutions by infusing the art of data visualization into every dashboard. From real-time clarity to crafting a seamless user experience, ZIF Dx+ is not just a digital experience management tool; it’s a canvas where data transforms into actionable insights, empowering organizations on their journey to digital excellence.
Empower your data storytelling with ZIF Dx+ custom dashboards, where you take charge of insights, visualize key metrics with precision, and navigate through an interface designed for optimal customization. Elevate your data visualization experience and unleash the full potential of your digital landscape.
Please complete the form details and a customer success representative will reach out to you shortly to schedule the demo. Thanks for your interest in ZIF!