
Augmented Analytics with SAP Analytics Cloud
In 2017, Gartner coined the term ‘augmented analytics’ and claimed it would be the future of data analytics. They predicted it would be a dominant driver of new purchases of analytics and business intelligence as well as data science and machine learning platforms, and of embedded analytics.
Here is the why and how.
Most organizations depend on data to back up its decision-making and strategy. Organizations collect data on all accounts of processes and events; thus, analyzing and effectively managing the breadth of this data is challenging yet significant for mining it for business insights.
Traditional business intelligence tools have given way to a new generation of business intelligence tools – Augmented Analytics technology.
Augmented Analytics is an approach of data analytics that employs machine learning (ML) and natural language processing (NLP) to automate and improve data access and data quality, uncover hidden patterns and correlations in data, pinpoint what’s driving results, predict future results and suggest actions to maximize or minimize desirable or undesirable outcomes.
Augmented Analytics is designed to conduct analyses and generate business insights automatically with little to no supervision and can be used without needing the assistance of a business analyst or data scientist. However, the focus of Augmented Analytics stays in its assistive role, where technology does not replace humans but supports them.
Business Intelligence (BI) and Analytics has evolved, increasing the demand for decision making through data analytics. It drives to unfold from traditional mirror reporting into self-service Business Intelligence and analytics.
Despite the advances in self-service analytics with agile discovery, many businesses demand assistance to uncover insights in data.
The next generation of BI and analytics products are augmented with artificial intelligence (AI) including ML, which automates complex analytics processes, and NLP makes it easier for users without knowledge of data science or query languages to obtain insights.
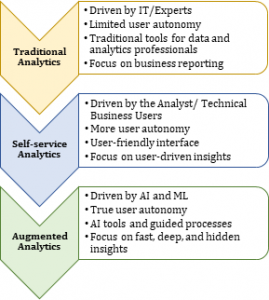
Augmented analytics offer starting-point suggestions and guidance to the users. It also empowers businesses to leverage more of their data to make better decisions when compared to the traditional and self-service Business Intelligence.
SAP Analytics Cloud (SAC) is an analytical solution that features all the analytics functionalities like business intelligence, augmented analytics, predictive analytics, enterprise planning, and application building in one intuitive user interface. It is empowered with ML and built-in AI that helps discover in-depth insights, simplify access to critical information and enable adequate decision-making.
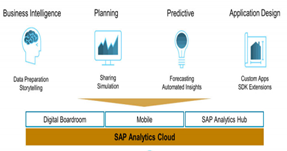
Augmented analytics capabilities offered by SAP Analytics Cloud empowers business intelligence to reap the benefits of AI and ML.
SAP Analytics Cloud facilitates users to interact with the system using natural language to gather automatic insights, where Predictive Scenarios offer an accessible way into Predictive Analytics using the past data to foresee the future.
Let’s look at the Analytics features, and capabilities offered by SAP Analytics Cloud
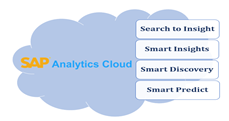
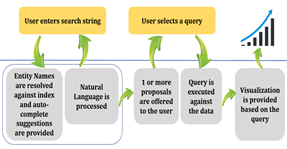
The Search to Insight feature enables query search through natural language through conversational AI and NLP. No knowledge of query languages like SQL, R, or Python is required. Asking questions just like in a search engine or digital personal assistant fetches insightful answers represented by visualization or numeric values tailored based on the question type.
Search to Insight provides auto-complete suggestions to match words or phrases in questions for measures and dimensions in the data and includes auto spell-check.
Smart Insights – Instant explanations
The Smart Insights feature facilitates digging deeper into the data points. It analyzes the underlying dataset and runs various statistical algorithms to offer insights based on the current user context.
It helps to understand top contributors of specific data points without having to manually pivot or slice and dice the data. When a data point is selected, ML calculations run on information that is of the same nature as the selected data point. For example, if the selected data point is ‘Total Revenue’, the top contributors are based on ‘Total Revenue’. It analyzes the dimension in the selected data and looks for members in these dimensions that influence the selected value.
Smart Discovery – Easily reveal insights
The Smart Discovery feature identifies hidden patterns and statically relevant relationships in the data to discover how business factors influence performance. It helps to understand the business drivers behind the core KPIs.
Based on the selection of measure or dimension, smart discovery automatically generates interactive story pages as below –
Overview: It explains the data distribution, summary of trends, and the detected patterns for the target dimension or measure.
Key Influencers: It explains the influence of the dimensions for the value of the target measures in the context of the selected model using classification and regression techniques, where the classification techniques are used to identify dimensions that segregate results into different groups of results and the regression techniques identify relationships between data points to predict future results.
Unexpected Values: It displays the details about outliers, where the actual values differ greatly from what the predictive model would expect. If an actual value diverges from the regression line it is categorized as unexpected.
Simulation: The simulation facilitates the ‘what-if’ analysis, users can change the values of the measures and dimensions to see the predicted change positively, negatively, or neutrally in the target measure.
Smart Predict – Answers the toughest questions
Smart Predict feature predicts the likelihood of different outcomes based on the historical data using techniques such as data mining, statistics, machine learning, and artificial intelligence.
Smart Predict, also referred as Predictive forecasting, considers different values, trends, cycles, and/or fluctuations in the data to make predictions that can be leveraged to aid business planning processes.
Smart Predict provides 3 different predictive scenario options for selection
Classification: It can be used to generate predictions for a binary event. For example, whether individual customers would be likely to buy the target product or not.
Time Series: It can be used to forecast values over a set period. For example, forecasting the sales of product by month or week, using historical data.
Regression: It can be used to predict values and explore key values behind them. For example, predicting the price of an imported product based on projected duties or shipping charges.
In the modern world of business Intelligence, SAP Analytics cloud’s ML technology augments the analytic process which assists from insights to actions and enables avoiding the agenda-driven and biased decision making by revealing the accurate patterns which drives the business.

" Kashif is a SAP Business objects consultant and a business analytics enthusiast. He believes that the “Ultimate goal is not about winning, but to reach within the depth of capabilities and to compete against yourself to be better than what you are today. "

We are proud to stay that ZIFTM is currently the only AIOps platform in the market to have a native mobile version! Look for ZIFTM AIOps on the App Store and Google Play Store.

Please complete the form details and a customer success representative will reach out to you shortly to schedule the demo. Thanks for your interest in ZIF!
