
Anomaly Detection in AIOps
Before we get into anomalies, let us understand what is AIOps and what is its role in IT Operations. Artificial Intelligence for IT operations is nothing but monitoring and analyzing larger volumes of data generated by IT Platforms using Artificial Intelligence and Machine Learning. These help enterprises in event correlation and root cause analysis to enable faster resolution. Anomalies or issues are probably inevitable, and this is where we need enough experience and talent to take it to closure.
Let us simplify the significance of anomalies and how they can be identified, flagged, and resolved.
Anomalies are instances when performance metrics deviate from normal, expected behavior. There are several ways in which this occur. However, we’ll be focusing on identifying such anomalies using thresholds.
With current monitoring systems, anomalies are flagged based on static thresholds. They are constant values that provide the upper limits of a normal behavior. For example, CPU usage is considered anomalous when the value is set to be above 85%. When anomalies are detected, alerts are sent out to the operations team to inspect.
Monitoring the health of servers are necessary to ensure the efficient allocation of resources. Unexpected spikes or drop in performance such as CPU usage might be the sign of a resource constraint. These problems need to be addressed by the operations team timely, failing to do so may result in applications associated with the servers failing.
Thresholds are the limits of acceptable performance. Any value that breaches the threshold are indicated in the form of alerts and hence subjected to a cautionary resolution at the earliest. It is to be noted that thresholds are set only at the tool level, hence that way if something is breached, an alert will be generated. These thresholds, if manual, can be adjusted accordingly based on the demand.
There are 2 types of thresholds;
This is definitely not the case. Like most things in life, it has its fair share of problems. Routing from philosophy back to our article, there are disadvantages in the Static Threshold way of doing things, although the ones with a dynamic threshold are minimal. We should also understand that with the appropriate domain knowledge, there are many ways to overcome these.
Consider this scenario. Imagine a CPU threshold set at 85%. We know anything that breaches this, is anomalies generated in the form of alerts. Now consider the same threshold percentage as normal behavior in a Virtual Machine (VM). This time, the monitoring tool will generate alerts continuously until it reaches a value below the threshold. If this is left unattended, it will be a mess as there might be a lot of false alerts which in turn may cause the team to fail to identify the actual issue. It will be a chain of false positives that occur. This can disrupt the entire IT platform and cause an unnecessary workload for the team. Once an IT platform is down, it leads to downtime and loss for our clients.
As mentioned, there are ways to overcome this with domain knowledge. Every organization have their own trade secrets to prevent it from happening. With the right knowledge, this behaviour can be modified and swiftly resolved.
Of course, anomalies should be resolved at the earliest to prevent the platform from being jeopardized. There are a lot of methods and machine learning techniques to get over this. Before we get into it, we know that there are two major machine learning techniques – Supervised Learning and Unsupervised Learning. There are many articles on the internet one can go through to have an idea of these techniques. Likewise, there are a variety of factors that could be categorized into these. However, in this article, we’ll discuss an unsupervised learning technique – Isolation Forest amongst others.
The algorithm isolates observations by randomly selecting a feature and then randomly selecting a split value between the maximum and minimum values of the selected feature.
The way that the algorithm constructs the separation is by first creating isolation trees or random decision trees. Then, the score is calculated as the path length to isolate the observation. The following example shows how easy it is to separate an anomaly-based observation:
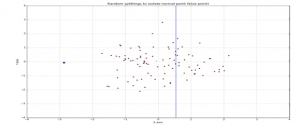
In the above image, the blue points denote the anomalous points whereas the brown ones denote the normal points.
Anomaly detection allows you to detect abnormal patterns and take appropriate actions. One can use anomaly-detection tools to monitor any data source and identify unusual behaviors quickly. It is a good practice to research methods to determine the best organizational fit. One way of doing this is to ideally check with the clients, understand their requirements, tune algorithms, and hit the sweet spot in developing an everlasting relationship between organizations and clients.
ZIF, as the name suggests, focuses on trending organization towards zero incidents. With knowledge we’ve accumulated over the years, Anomaly Detection is made as robust as possible resulting in exponential outcomes.

“Vimalraj is a seasoned Data Scientist working with vast data sets to break down information, gather relevant points, and solve advanced business problems. He has over 8 years of experience in the Analytics domain, and currently a lead consultant at GAVS.“

We are proud to stay that ZIFTM is currently the only AIOps platform in the market to have a native mobile version! Look for ZIFTM AIOps on the App Store and Google Play Store.

Please complete the form details and a customer success representative will reach out to you shortly to schedule the demo. Thanks for your interest in ZIF!
