With the use of hybrid technologies and distributed components, the applications are becoming increasingly complex. Irrespective of the complexity, it is quite important to ensure the end-user gets an excellent experience in using the application. Hence, it is mandatory to monitor the performance of an application to provide greater satisfaction to the end-user.
External factors
When the web applications face performance issues, here are some questions you need to ask:
Does the application always face performance issues or just during a specific period?
Whether a particular user or group of users face the issue or is the problem omnipresent for all the users?
Are you treating your production environment as real production environment or have you loaded it with applications, services, and background processes running without any proper consideration?
Was there any recent release to any of the application stack like Web, Middle Tier, API, DB, etc., and how was the performance before this release?
Have there been any hardware or software upgrades recently?
Action items on the ground
Answering the above set of questions would have brought you closer to the root cause. If not, given below are some steps you can do to troubleshoot the performance issue:
Look at the number of incoming requests, is the application facing unusual load?
Identify how many requests are delaying more than a usual level, say more than 5000 milliseconds to serve a request, or a web page.
Is the load getting generated by a specific or group of users – is someone trying to create intentional load?
Look at the web pages/methods/functions in the source code which are taking more time. Check the logs of the web server, this can be identified provided the application does that level of custom logging.
Identify whether any 3rd party links or APIs which are being used in the application is causing slowness.
Check whether the database queries are taking more time.
Identify whether the problem is related to a certain browser.
Check if the server side or client side is facing any uncaught exceptions which are impacting the performance.
Check the performance of the CPU, Memory, and Disk of the server(s) in which the application is hosted.
Check the sibling processes which are consuming more Memory/CPU/Disk in all servers and take appropriate action depending on whether those background processes need to be in that server or can be moved somewhere or can be removed totally.
Look at the web server performance to fine tune the Cache, Session time out, Pool size, and Queue-length.
Check for deadlock, buffer hit ratio, IO Busy, etc. to fine tune the performance.
Challenges
Doing all these steps exactly when there is a performance issue may not be practically all the time. By the time you collect some of these, you may lose important data for the rest of the items unless the history data is collected and stored for reference.
Even if the data is collected, correlating them to arrive at the exact root cause is not an easy task
You need to be tech savvy across all layers to know what parameters to collect and how to collect.
And the list of challenges goes on…
Think of an ideal situation where you have metrics of all these action items described above, right in front of you. Is there such magic bullet available? Yes, ZIF Application Performance Monitoring (ZIF APM), it gives you the above details at your fingertips, thereby makes troubleshooting a simple task.
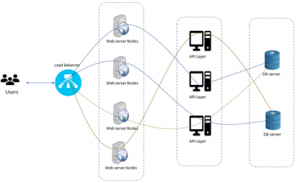
ZIF APM has more to offer than other regular APM. The APM Engine has built-in AI features. It monitors the application across all layers, starting from end-user, web application, web server, API layers, databases, underlying infrastructure that includes the OS and performance factors, irrespective of whether these layers are hosted on cloud or on-premise or both. It also applies the AI for monitoring, mapping, tracing and analyze the pattern to provide the Observability and Insights. Given below is a typical representation of distributed application and its components. And the rest of the section covers, how ZIF APM provides such deep level of insights.
Once the APM Engine is installed/run on portfolio servers, the build-in AI engine does the following automatically:
Monitors the performance of the application (Web) layer, Service Layer, API, and Middle tier and Maps the insights from User <–> Web <–> API <–> Database for each and every applications – No need to manually link Application 1 in Web Server A with API1 in Middle Tier B and so on.
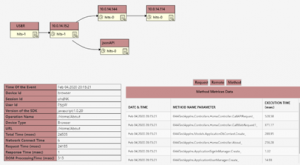
Traces the end-to-end user transaction journey for all transactions with Unique ID.
Monitors the performance of the 3rd party calls (e.g. web service, API calls, etc.), no need to map them.
Monitors the End User Experience through RUM (Real User Monitoring) without any end-user agent.
<A reference screenshot of how APM maps the user transaction journey across different nodes. The screenshot also gives the Method level performance insights>
Why choose ZIF APM? Key Features and Benefits
All-in-One – Provides the complete insight of the underlying Web Server, API server, DB server related infrastructure metrics like CPU, Memory, Disk, and others.
End-user experience (RUM) – Captures performance issues and anomalies faced by end-user at the browser side.
Anomalies detection – Offers deeper insights on the exceptions faced by the application including the line number in the source code where the issue has occurred.
Code-level insights – Gives details about which method and function calls within the source code is taking more time or slowing down the application.
3rd Party and DB Layer visibility – Provides the details about 3rd party APIs or Database calls and Queries which are delaying the web application response.
AHI – Application Health Index is a scorecard based on A) End User Experience, B) Application Anomalies, C) Server Performance and D) Database performance factors that are applicable in the given environment or application. Weightage and number of components A, B, C, D are variables. For instance, if ‘Web server performance’ or ‘Network Performance’ needs to be brought in as new variable ‘E’, then accordingly the weightage will be adjusted/calculated against 100%.
Pattern Analysis – Analyzes unusual spikes through pattern matching and alerts are provided.
GTrace – Provides the transaction journey of the user transaction and the layers it is passing through and where the transaction slows down, by capturing the performance of each transaction of all users.
JVM and CLR – Provides the Performance of the underlying operating system, Web server, and run time (JVM, CLR).
LOG Monitoring – Provides deeper insight on the application logs.
Problem isolation– ZIF APM helps in problem isolation by comparing the performance with another user in the same location at the same time.
“Suresh heads the Monitor component of ZIF. He has 20 years of experience in Native Applications, Web, Cloud, and Hybrid platforms from Engineering to Product Management. He has designed & hosted the monitoring solutions. He has been instrumental in conglomerating components to structure the Environment Performance Management suite of ZIF Monitor. Suresh enjoys playing badminton with his children. He is passionate about gardening, especially medicinal plants.“
Please complete the form details and a customer success representative will reach out to you shortly to schedule the demo. Thanks for your interest in ZIF!
ZIF uses cookies to personalize and improve our reader experience. By pursuing your navigation on our website, you agree to our use of cookies as described in our cookie policy.
Got ItPrivacy Policy